Most people who’ve done at least a bit of research on the topic of investing will be familiar with the common investable asset classes: equities (stocks), fixed-income (bonds), real estate, commodities, and perhaps even crypto. Investment portfolios tend to be sliced up among them in various allocations to achieve diversification, by ‘not putting all our eggs in one basket’.
So what makes volatility (which is essentially a statistic) an investable, or at least a tradeable asset class?
Much like stocks give us easy access to equities, or REITs give us access to real estate, there are also securities that offer access to equity market volatility. The two most accessible are options and the various volatility exchanged-traded notes (ETNs) such as VXX, UVXY, SVXY, etc.
Options are inherently volatility products. Their pricing is based heavily on the implied (expected) volatility of the underlying stock or index, which causes their prices to expand or contract along with IV.
Volatility ETNs (VXX and UVXY) offer exposure to the implied volatility of the S&P 500 stock market index via VIX futures. Their share prices rise and fall with the changing values of the VIX futures they hold, and tend to experience long term ‘decay’ similar to other insurance-style securities, like options.
Why might someone be interested in trading volatility, in one of its many forms?
A) Diversification and B) the potential for higher returns beyond what investing in stocks and bonds alone can offer. Anything that is well, volatile, has profit potential. We just need to study it and find ways to extract those benefits while minimizing risk. Volatility also has several desirable characteristics:
• It tends to be mean-reverting. In other words, it falls within a somewhat ‘normal’ range most of the time.
• It has a very strong negative correlation to equities. The long term VIX to S&P 500 correlation is about -70%. This is key for diversification.
• There is a frequently observed risk premium between implied (expected) and historical (realized) volatility. If insurance was always needed 100% of the time, there would be no insurance companies.
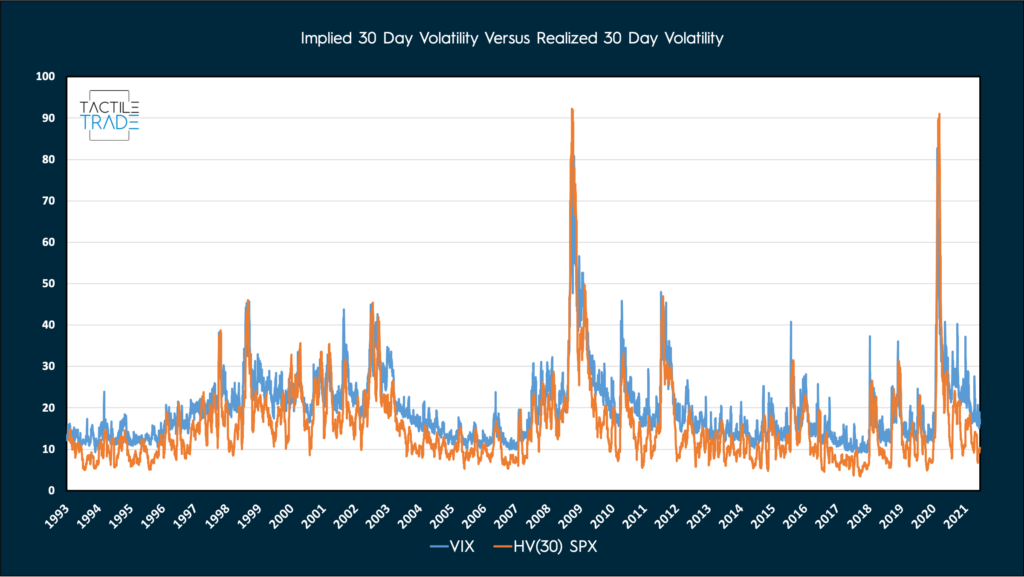
It’s very important to understand there are times when this ‘insurance’ is actually warranted. During these times, volatility sellers (insurance providers) will get absolutely pummelled. Which is why I personally think the only approach to safely trade volatility is to actively manage both sides of it using multiple factors. What does this mean?

While we can’t predict what volatility or the stock market will do tomorrow, we can do our best to be properly positioned based on a balance of probabilities. By tracking volatility-specific data along with our other indicators, selecting appropriate trades from our toolbox, and using good risk management such as position sizing, we can make better informed decisions on which volatility glove to strike with.
Adding a 20% allocation to a simplified short volatility strategy in a hypothetical portfolio
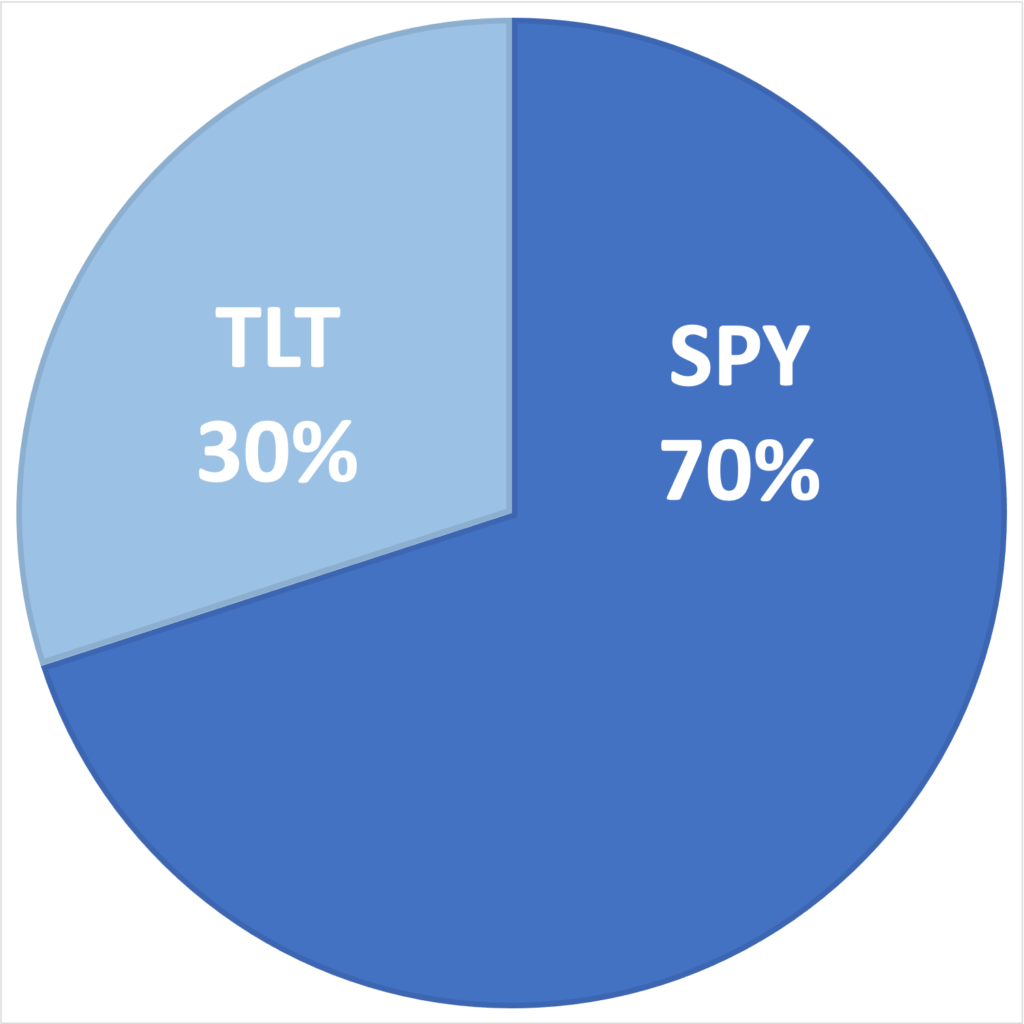
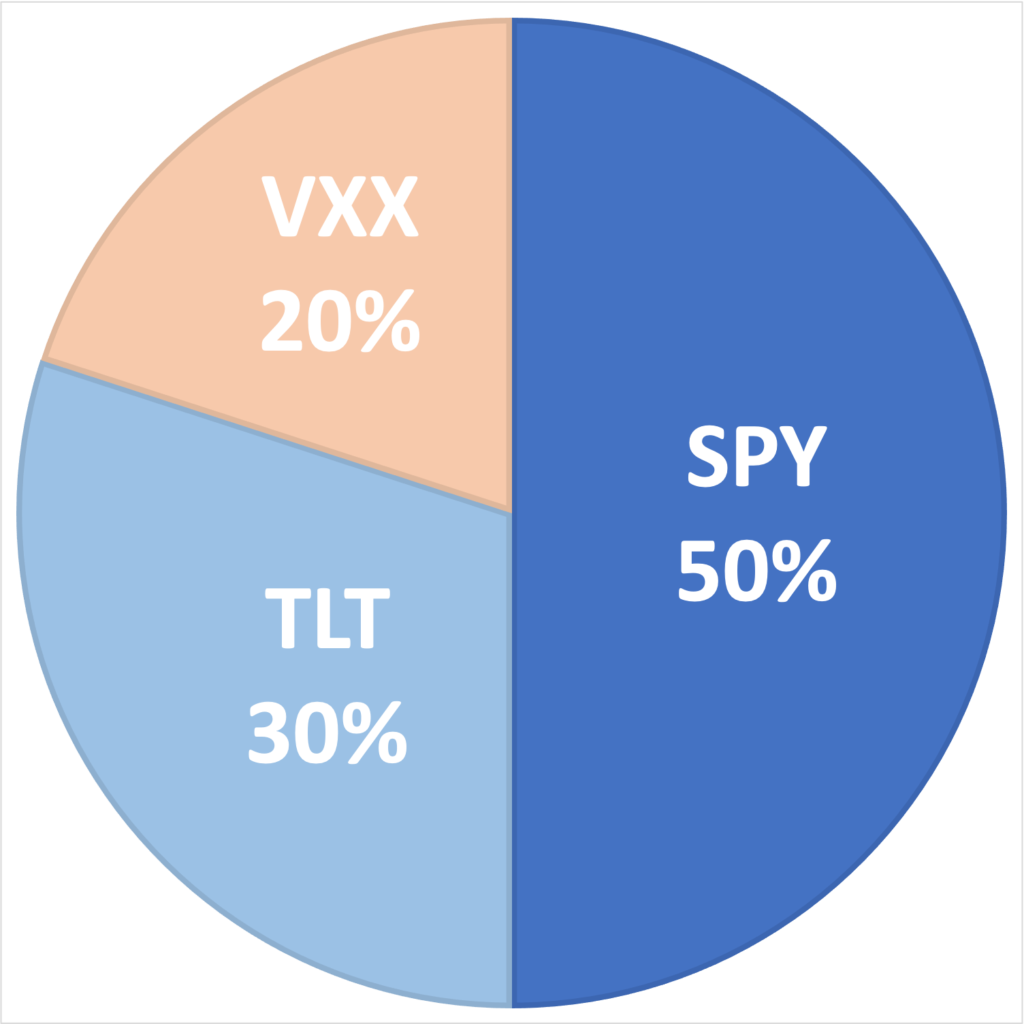
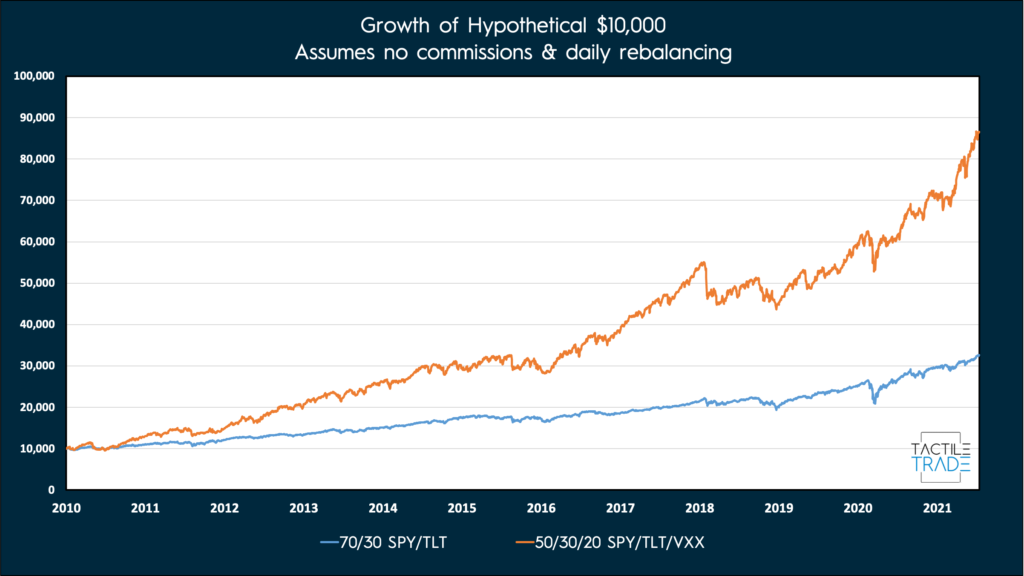
Let’s consider two hypothetical portfolios from January 2010 until July, 2021. One with only the SPY (S&P 500 ETF) and TLT (20+ Year U.S. Treasuries), plus another with a 20% allocation to an overly-simplified short VXX strategy.
Let’s assume our strategy is short VXX whenever the Month 2 VIX Future is below the Month 3 VIX Future. Let’s ignore the fact we aren’t risk-managing this strategy at all just shorting VXX naked, and assume no trade commissions.
| Annualized Return | Annualized Volatility | Maximum Drawdown | Correlation to SPY | |
| SPY/TLT Only | 10.82% | 10.71% | -21.20% | 93.19% |
| SPY/TLT/Short VXX Strat. | 20.64% | 15.89% | -20.83% | 77.95% |
Of course, I should throw in the usual disclaimer – past performance is not indicative of future returns, you need to factor in commissions, either hedging or use of some defined-risk instrument to short VXX.
The difference is astounding. For a mere 20% of your portfolio, the annualized return doubles and the correlation to SPY drops substantially adding some much needed diversification. This is the potential of volatility as an asset class, provided risk can be effectively managed.