SmartLev, our leveraged ETF trading strategy, tactically rotates between the ProShares Ultra S&P500® (SSO), and the iShares 7-10 Year Treasury Bond ETF (IEF). I use SSO in my own personal trading and report the strategy’s performance with SSO monthly. That said, some community members prefer to use the ‘SSO’ signals with other leveraged or non-leveraged ETFs such as the 3x UPRO or 1x SPY. The nice thing about the ‘SSO’ signals of SmartLev is that they can be used as a proxy for holding any US broad market ETF, depending on your personal preference and appetite for leverage.
Unlike SSO, substituting SmartLev’s ‘IEF’, or ‘defensive’ signals with other fixed income ETFs does not result in similar performance, at least when backtested. In this post, I’d like to provide some hard data as to why IEF is the most well balanced fixed income ETF for the strategy (that I’ve found so far).
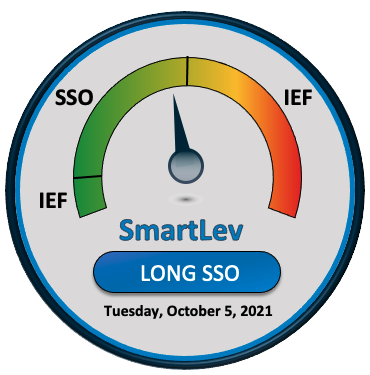
SmartLev’s default position is SSO. When the two dozen VIX-derived, momentum, and correlation indicators I track daily breach certain thresholds, the strategy exits SSO entirely and moves into IEF. An IEF signal can be triggered either on the high end when tail risk is elevated, or the extreme low end when markets might be overbought and volatility is compressed.
Let’s isolate the ‘IEF’ signals only and backtest 8 other possible substitutes for 7-10 year US treasuries. While there are dozens of fixed income ETFs available, I chose these as the most liquid and viable alternatives to IEF. In these tests, I assumed $5 commissions per trade (the same as all my performance data); signals prior to February 1, 2021 are backtested, while signals after are live trading results.
But first, what exactly are we seeking when we want to tactically rotate out of stocks and into something else?
The answer is we want to rotate into a separate asset class that is well protected from a potential stock market crash, demonstrates behavior that is predictable, has a very low or negative correction to equities, and has the potential to outperform simply holding cash.
The best way to quantify this desired behavior is by measuring beta, which measures the magnitude and direction of correlation between two investments, or ETFs. In this case, we’re measuring the ETFs beta to the S&P 500. When looking for a ‘safety’ ETF, a slightly negative beta value is desirable and a good place to start. A high beta (greater than 1) or even a positive beta implies an ETF might behave too much like the stocks we’re rotating away from. At the same time, an extremely low negative beta (below -1), which implies an extreme negative correlation is also unsuitable. I believe a beta value slightly below zero is the sweet spot for being confident enough to rotate a big chunk of an investment portfolio into, when the strategy signals warrant it.
Historically, fixed income has been a good asset class to fit this criteria. It’s also quite diverse, with numerous different styles of bonds – government, corporate, inflation-protected, convertible, of varying durations. So lets examine 8 possible replacements for IEF, ranked from highest return to lowest return.
Jump directly to the table of returns, drawdowns & beta
TLT – 20+ Year US Treasuries
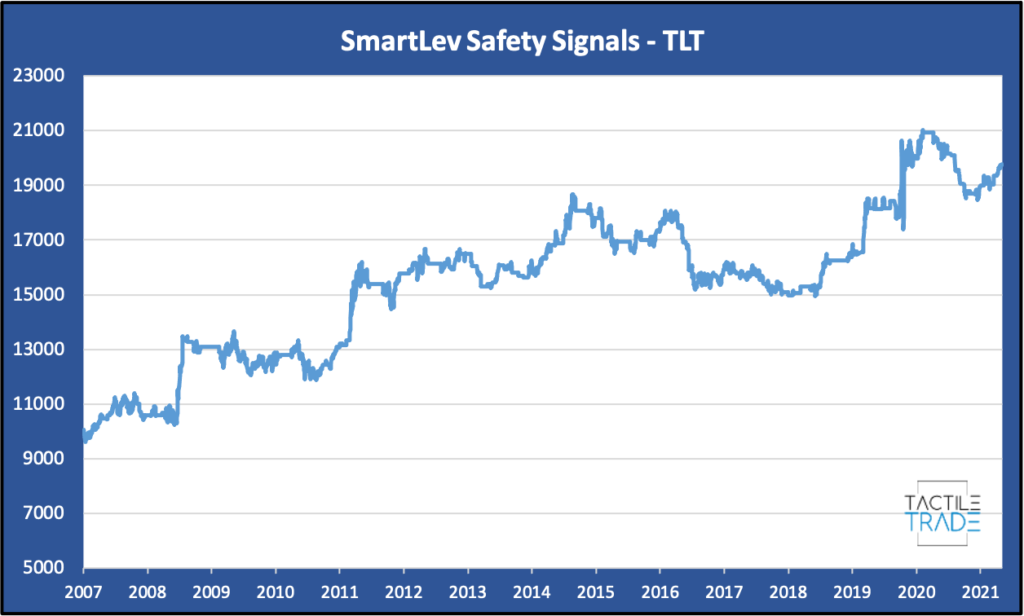
Despite producing a higher return than IEF (and the highest of all the tests) at 97%, I personally wouldn’t choose TLT as a replacement right now for one reason – Interest rate risk. Long term treasuries are the most sensitive to changes in interest rates. With the spectre of inflation and rate hikes on the horizon, I believe we need to position ourselves accordingly. This is an excellent example of where backtesting alone can’t give us all the answers. Just because something would have performed well in the past, it doesn’t mean we should jump to conclusions and start using it. We must always optimize for today going forward.
A side note: I think investors and asset managers alike put a little too much faith in bonds when making assumptions about the future performance of their portfolios. During the next bear market, we’ll likely be in a rising rate environment. Bonds might not do as good of a job picking up the slack as they have in 2002, 2008, even 2020. Of course Boomers love bonds because interest rates have been falling since the 1980s. Now we’re at basically zero, where to from here? This is one major aspect that draws me to tactical investing with leveraged equities and volatility as an asset class in lieu of being bond-heavy.
IEF – 7-10 Year US Treasuries
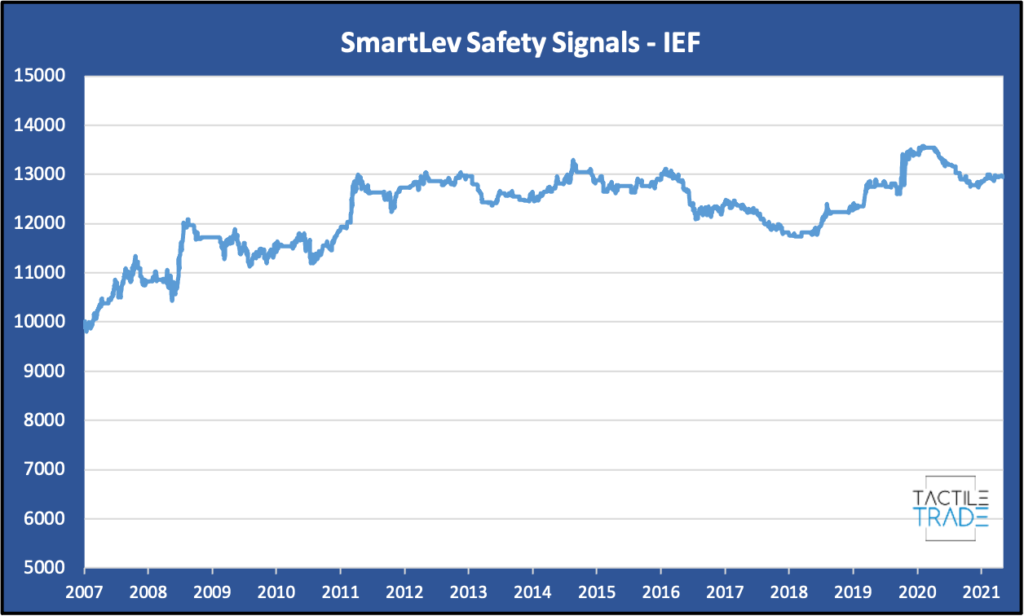
At a 29% return including commissions, IEF is the winner for me. Everything about 7-10 year treasuries just sings “balance” for me right now. IEF is sensitive enough to still justify trading, but not as volatile or risky as 20+ treasuries. If SmartLev ends up holding it for an extended duration during a bear market, it should do decently well.
VCIT – Vanguard Intermediate Term Corporate Bonds
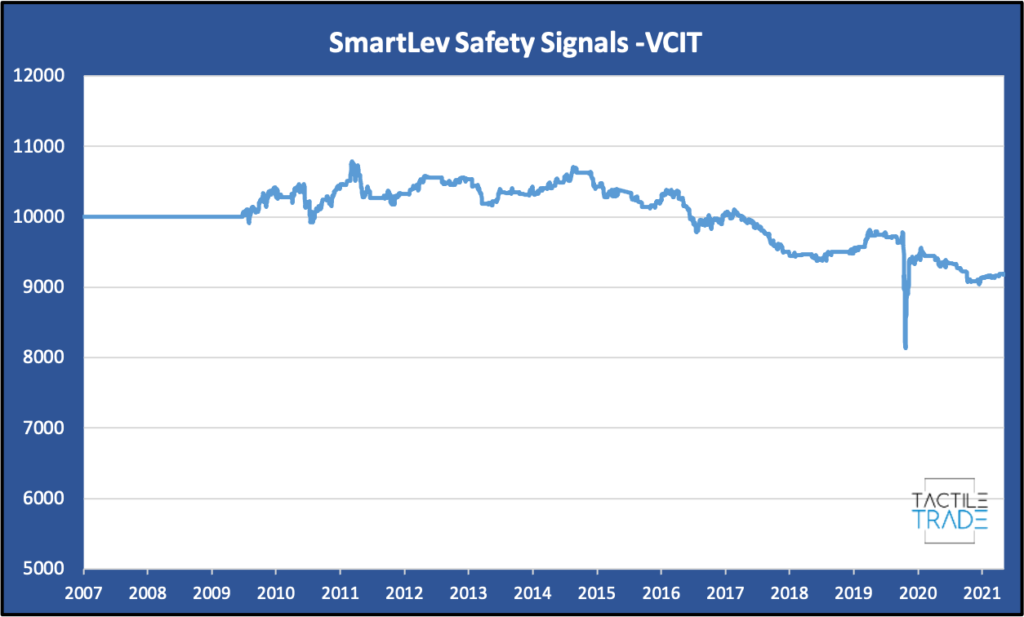
You would think being intermediate would strike a similar balance to IEF, but being corporate bonds, they still suffered an unacceptable drawdown during COVID and lacklustre performance overall.
BND – Vanguard Total Bond Market ETF
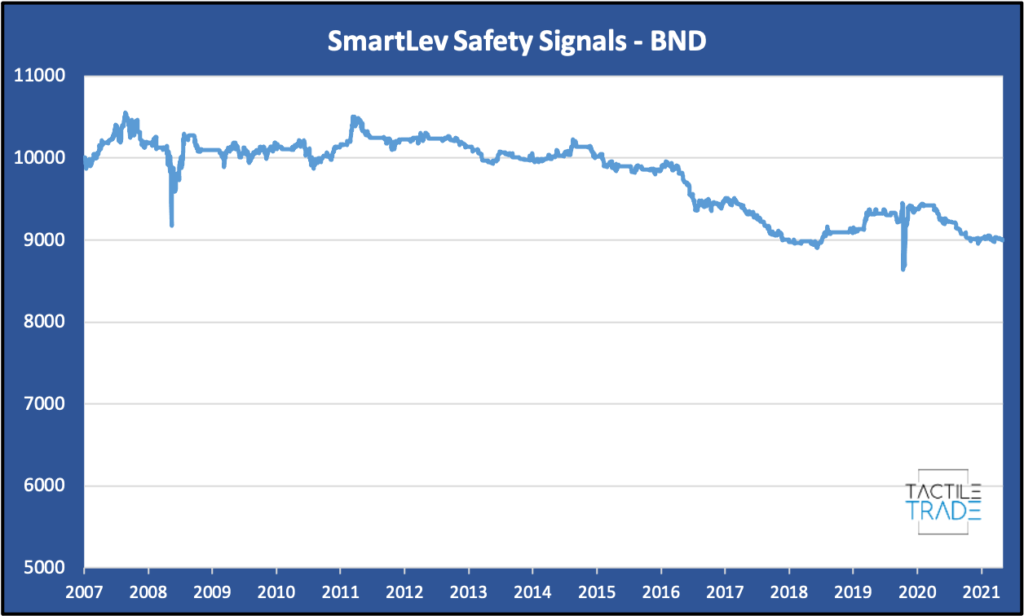
Still unacceptable overall with two distinct dips during 2008 and 2020. We’d be better off with cash.
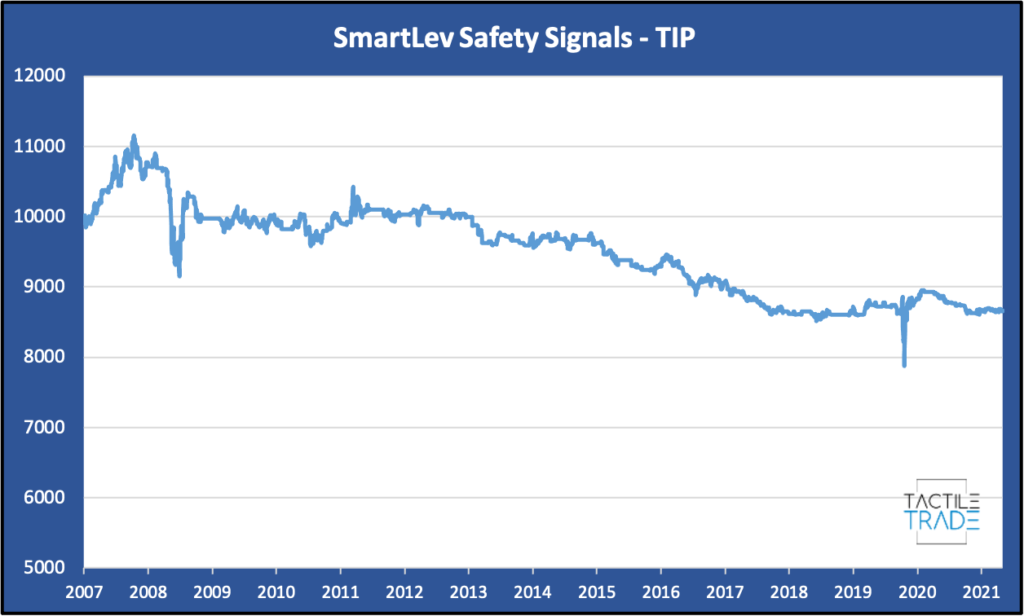
TIP – Inflation Protected Securities
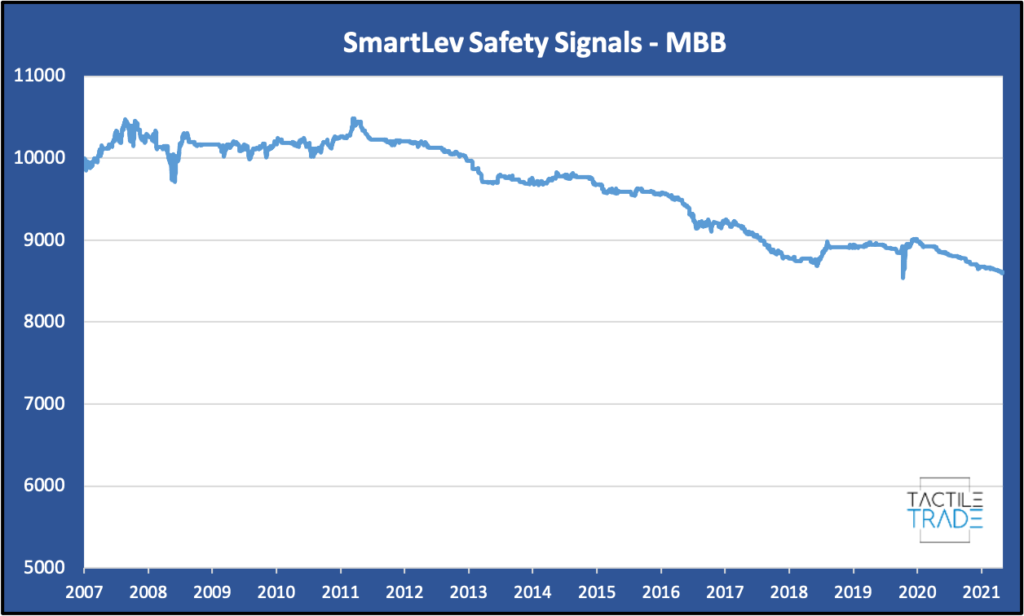
MBB – iShares Mortgage Backed Bonds ETF
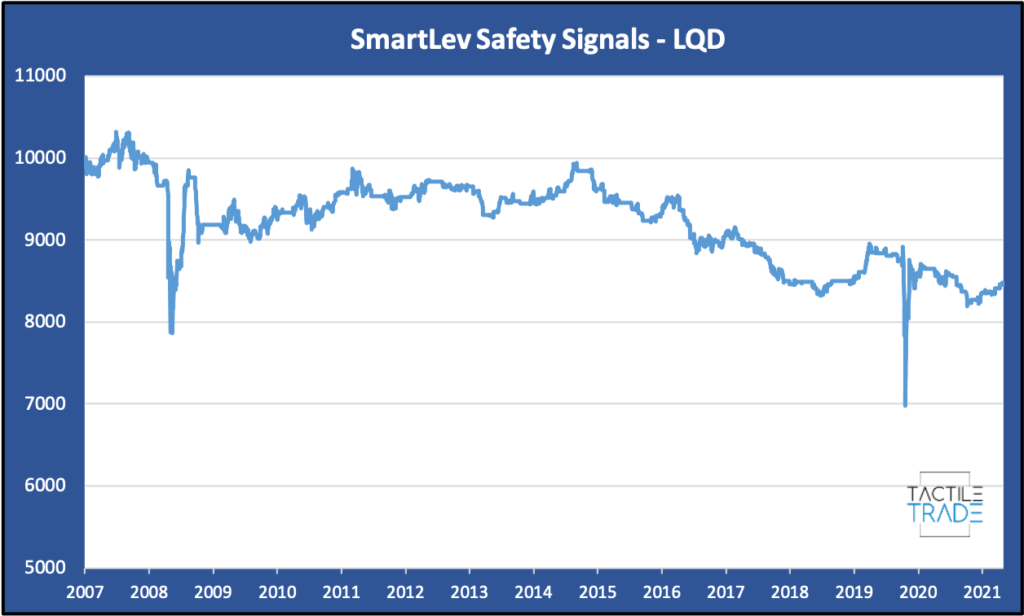
LQD – iShares Investment Grade Corporate Bonds ETF
SHY – 1-3 Year US Treasuries
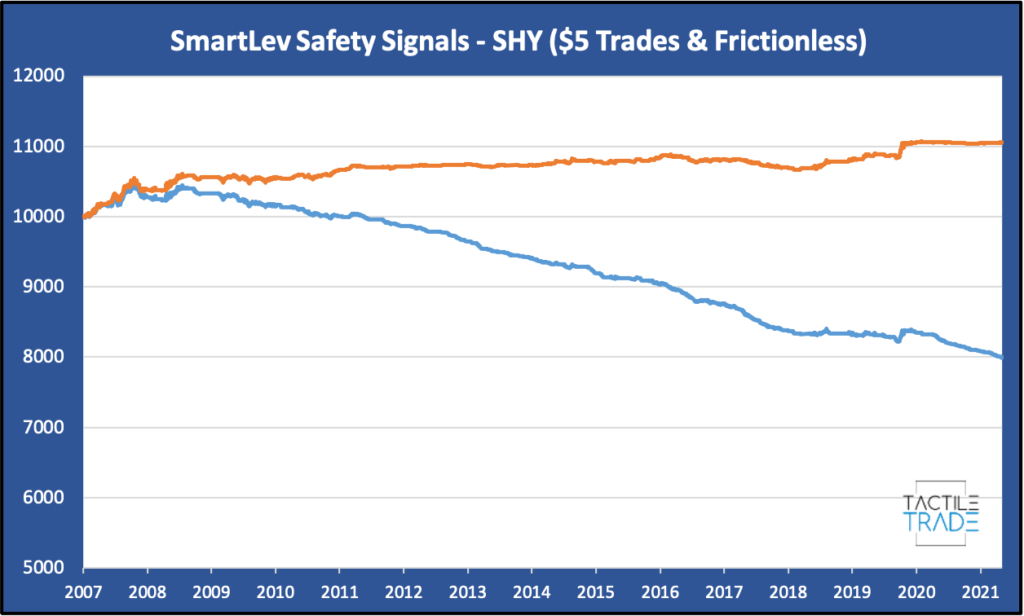
SHY is an interesting one. I included an equity curve for both the standard $5 commissions (blue) and frictionless capital (orange). Notice the stunning difference trade commissions make. No point in using SHY for any tactical strategy, it’s not worth holding at all.
CWB – Convertible Bonds
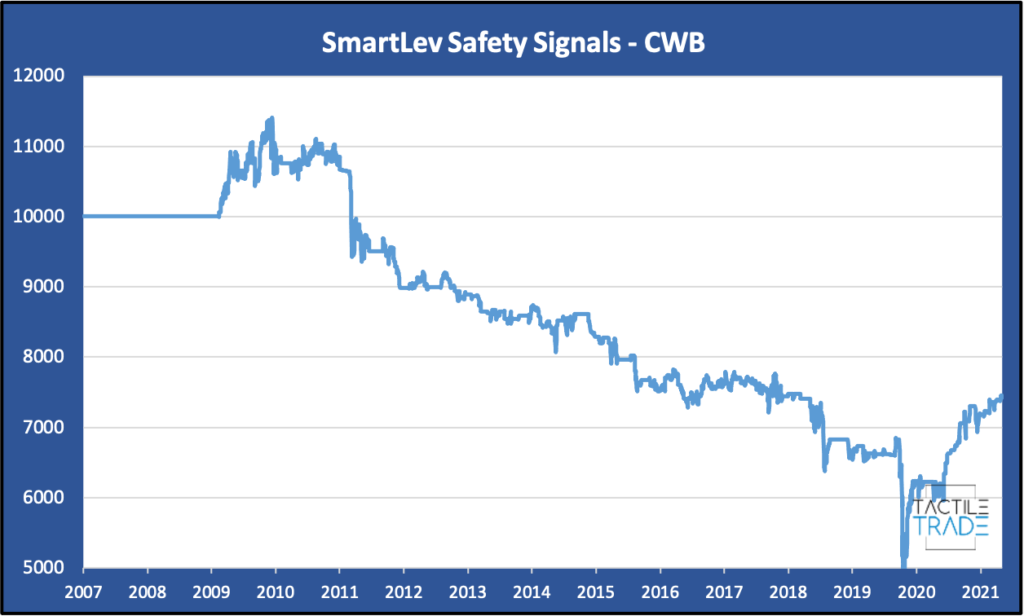
Coincidently, CWB has the lowest return and highest beta. Convertible bonds behave more like stocks, thus are a poor choice to be holding when the stock market crashes.
Here’s the table with the returns for each ETF, along with maximum drawdown and the ETF’s daily beta value:
| Ticker | Total Return | Max DD | Beta |
|---|---|---|---|
| TLT | 97.68% | -19.98% | -0.32 |
| IEF | 29.52% | -11.79% | -0.14 |
| VCIT | -8.21% | -24.61% | 0.01 |
| BND | -10.00% | -18.22% | -0.02 |
| TIP | -13.40% | -29.46% | -0.06 |
| MBB | -13.93% | -18.58% | -0.02 |
| LQD | -15.51% | -32.35% | 0.06 |
| SHY | -20.04% | -23.77% | -0.02 |
| CWB | -25.84% | -59.06% | 0.37 |